Code
library(tidyverse)

cars %>%
  ggplot(aes(x = dist, y = speed)) +
  geom_point(color = "blue") +
  labs(title = "Test Plot",
       subtitle = "Data from Cars Dataset \n",
       x = "Distance",
       y = "Speed") +
  theme_minimal()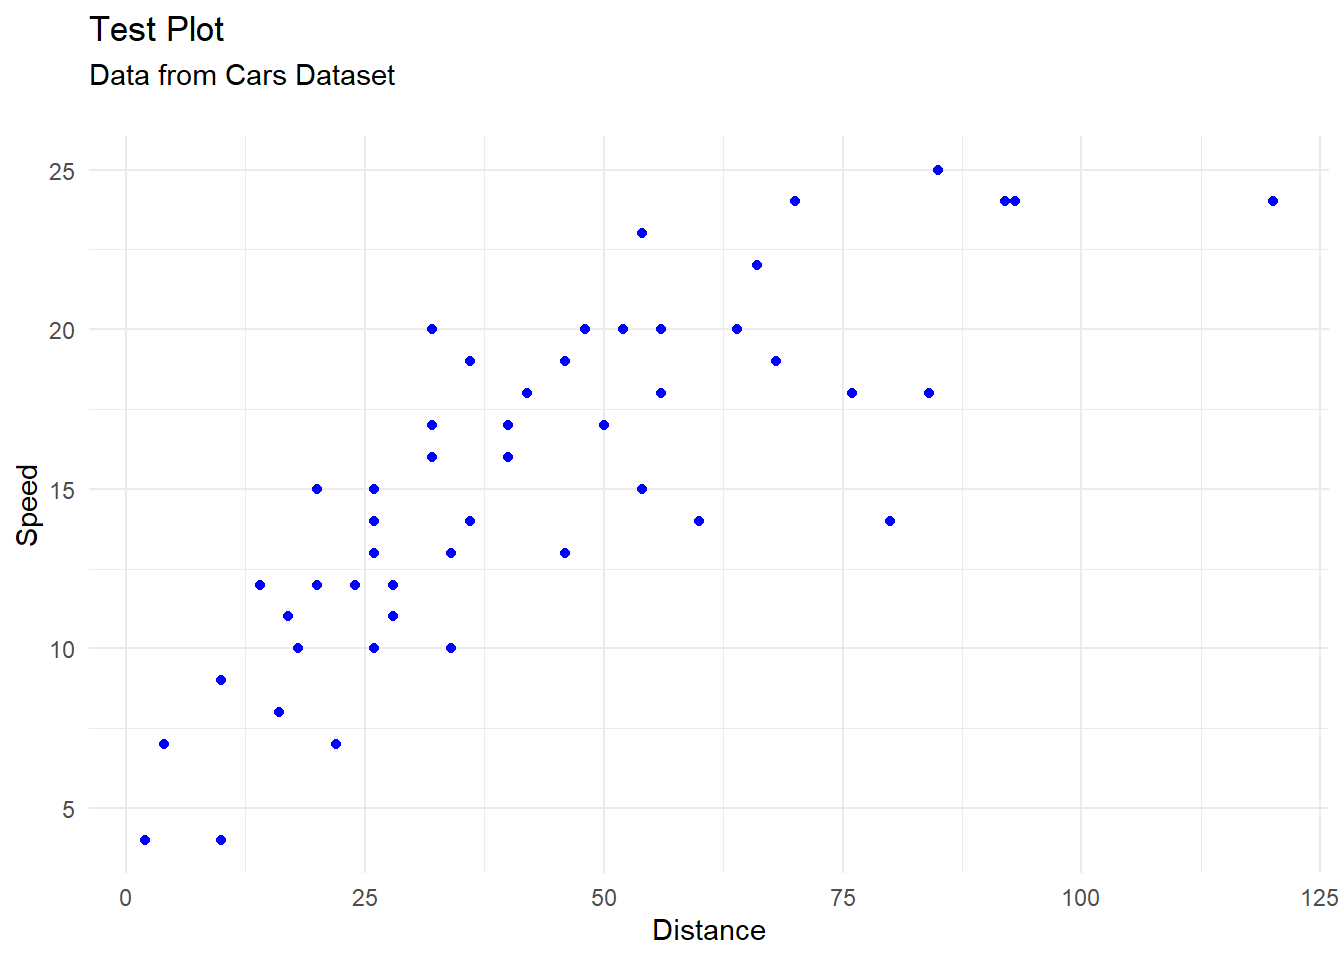
This is the first blog post. I’m attempting to experiment with r-coding here to see how it looks in html format. I also did a snapshot with renv() to experiment with package management.
library(tidyverse)
cars %>%
ggplot(aes(x = dist, y = speed)) +
geom_point(color = "blue") +
labs(title = "Test Plot",
subtitle = "Data from Cars Dataset \n",
x = "Distance",
y = "Speed") +
theme_minimal()